BBA Class of 2025 Internship Employment
| Industry | # of Students Reported | % of Students Reported |
|---|---|---|
| Financial Services | 144 | 44% |
| Consulting | 50 | 15% |
| Accounting | 20 | 6% |
| Real Estate / Construction | 16 | 5% |
| Media / Entertainment | 11 | 3% |
| Technology / Science | 10 | 3% |
| Healthcare | 9 | 3% |
| Marketing / Advertising / Public Relations | 9 | 3% |
| Consumer Packaged Goods | 8 | 2% |
| Retail | 6 | 2% |
| Government / Education | 6 | 2% |
| Sports / Leisure | 5 | 2% |
| Non-Profit | 4 | 1% |
| Transportation / Logistics | 4 | 1% |
| Hospitality | 2 | 1% |
| Legal | 2 | 1% |
| Other | 24 | 7% |
Other includes Manufacturing, Pharma/Biotech, Retail, Other. Percentage is out of those reported, not total class.
-
Paid or for Credit Internships
Class of 2025 -
Internships Inside the U.S.
Class of 2025 -
Average Hourly Internship Salary
Class of 2025
Internships by Region
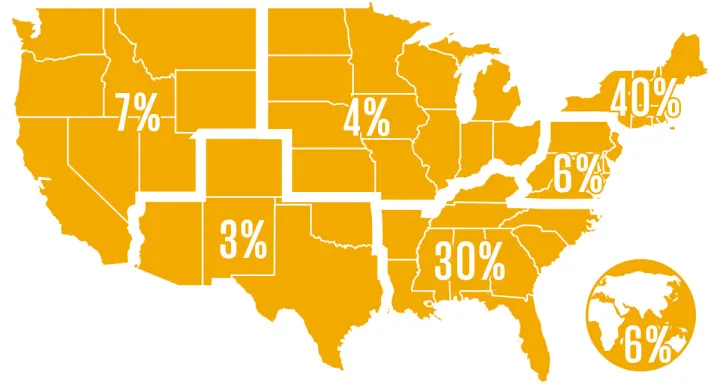
International Internship Destinations: Australia, Brazil, China, Guatemala, India, Israel, Jordan, Pakistan, Singapore, Taiwan, Turkey.