| Function | % of Class | Median Base Salary |
|---|---|---|
| Consulting | 41% | $175,000 |
| Financial Services | 21% | $175,000 |
| Healthcare | 13% | $155,000 |
| Technology | 9% | $121,980 |
| Consumer Packaged Goods / Retail | 6% | $112,500 |
| Transportation & Logistics Services | 3% | * |
| Energy | 1% | * |
| Hospitality | 1% | * |
| Manufacturing | 1% | * |
| Real Estate | 1% | * |
| Other | 3% | * |
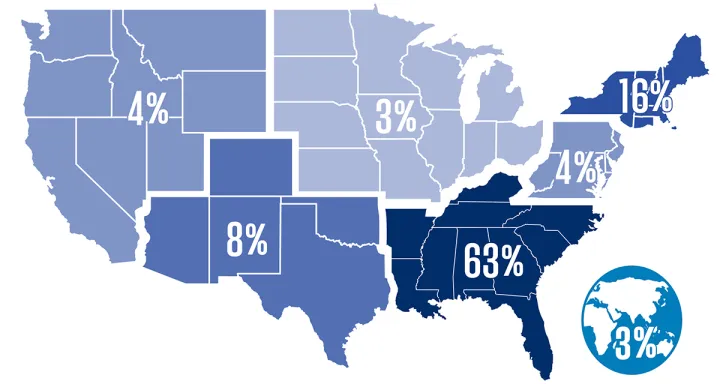
Employment by Region